
2021 was one of the seven warmest years ever recorded
La Niña events between 2020 and 2022 temporarily lowered global average temperatures, but despite this, 2021 became one of the seven warmest years on record, according to six major datasets with international standards consolidated by the World Meteorological Organization (WMO). All indications are that global warming, as well as other long-term climate change trends, will continue in the wake of unprecedented levels of heat-trapping greenhouse gases in the atmosphere.
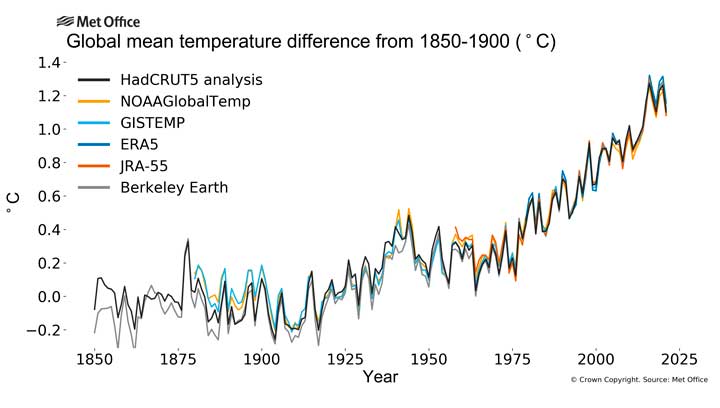
In 2021, the global average temperature was approximately 1.11 (±0.13) °C above pre-industrial (1850-1900) levels. Thus, 2021 is the seventh consecutive year (2015-2021) in which the global temperature has exceeded pre-industrial levels by more than 1 °C, according to all data sets compiled by the WMO.
To make the temperature assessment as comprehensive and reliable as possible, WMO uses six international data sets. These same data sets are used in the annual reports on the state of the climate that the Organization produces to communicate global climate indicators to the international community.
The place that each particular year occupies in the global ranking must be interpreted from a long-term perspective, especially since the differences between specific years are sometimes minimal. Since the 1980s, each new decade has been warmer than the last, and that trend is expected to continue.
The seven warmest years have all occurred since 2015, with the top three rankings being 2016, 2019 and 2020. The exceptionally strong El Niño in 2016 contributed to unprecedented global mean warming.
“Consecutive La Niña episodes meant that compared to recent years, the warming experienced in 2021 was relatively less pronounced. Even so, 2021 was warmer than previous years in which the effects of La Niña were felt. Long-term global warming from rising greenhouse gas concentrations is now far greater than the year-on-year variability in global average temperatures caused by naturally occurring climate drivers, said WMO Secretary-General Professor Petteri Taalas.
“The year 2021 will be remembered for the record temperature of almost 50°C recorded in Canada, comparable to the values observed in the hot Saharan desert of Algeria, for the exceptional rainfall and for the deadly floods that hit Asia and Europe, as well as by the drought that punished parts of Africa and South America. The impacts of climate change and climate-related hazards have had devastating, life-altering effects on communities on all continents,” said Professor Taalas.
Temperature is just one of the indicators of climate change, to which must be added greenhouse gas concentrations, the heat content of the oceans, oceanic pH, the global mean sea level, the mass of glaciers and the extent of sea ice.
International data sets
WMO uses datasets based on monthly climate data from observing sites and from ships and buoys that are part of global marine networks. These data sets are developed and maintained by the United States National Oceanic and Atmospheric Administration (NOAA), the National Aeronautics and Space Administration (NASA) Goddard Institute for Space Studies, the Hadley Center from the UK Met Office, the UK University of East Anglia Climatic Research Unit (HadCRUT) and the Berkeley Earth group.
WMO also uses reanalysis data sets from the European Center for Medium-Range Weather Forecasts (ECMWF), the Copernicus Climate Change Service and the Japan Meteorological Service (JMA). Reanalyses combine millions of weather and marine observations—including satellite ones—with additional values from models to produce comprehensive reanalyses of the atmosphere. The combination of observations and model results makes it possible to estimate the temperatures that occur at any time and in any place on the planet, even in areas for which little data is available, such as the polar regions.
The Copernicus climate change service estimates that 2021 was the fifth warmest year on record, although its values only slightly exceeded those recorded in 2015 and 2018. NOAA and Berkeley Earth consider 2021 to be the sixth warmest year in nominal terms. According to NASA’s GISTEMP dataset and HadCRUT, 2021 was, along with 2018, the sixth warmest year ever recorded. Finally, the JMA reanalysis data places 2021 as the seventh warmest year in nominal terms. The small differences between these data sets indicate the margin of error allowed for calculating the global mean temperature.
The temperature values will be incorporated into the final version of the WMO 2021 State of the Climate Report, which will be released in April 2022. That publication, which is the updated version of the interim report published in October 2021 coinciding with the 26th session of the Conference of the Parties (COP26) to the United Nations Framework Convention on Climate Change (UNFCCC), includes information on the set of main climate indicators and on certain effects attributed to climate.
The goal of the Paris Agreement is to keep the global average temperature rise well below 2°C above pre-industrial levels, and to pursue efforts to limit that rise to 1.5°C above pre-industrial levels. In 2021, the global average temperature was about 1.11°C higher than pre-industrial levels (1850-1900), which means that it is approaching the lower limit of the increase in temperature that the Paris Agreement seeks to avoid.
La Niña is a phenomenon that produces a large-scale cooling of the ocean surface temperature in the central and eastern parts of the equatorial Pacific, in addition to other changes in the tropical atmospheric circulation. Its effects on weather and climate are often opposite to those of the El Niño phenomenon. La Niña exerts a transitory cooling effect on a global scale, which is usually more intense in the second year of the episode.
*originally published by the World Meteorological Organization